Between the 1950s and 1970s, plastic waste was manageable worldwide because it was produced in relatively small amounts. After the 1970s, plastic production increased enormously, and so did plastic waste. Today, for instance, the amount of plastic packaging thrown away each year can circle the globe four times (Vuleta, 2022).
Now, more than 300 million tons of plastic waste are produced worldwide every year, which equals the combined weight of the total human population. Half of the plastics in production are SUPs. This plastic waste is intended to be used only for a short time and then discarded. However, SUPs will last for many centuries. The United Nations believe that between 60% and 90% of all garbage found in all continents littering the shorelines, floating on the surface, and reaching the seabed is plastic (Lindwall, 2020; Vuleta, 2022).
Plastic waste is growing worldwide at an annual rate of 9%. By 2040, the amount of plastic debris in the ocean will triple, which corresponds to 29 metric tons of plastic trash in the oceans. Specifically, it is expected that there will be 1.3 billion tons of plastic waste in the environment – on land and in bodies of water (and only a tiny portion of this is recycled) (Vuleta, 2022).
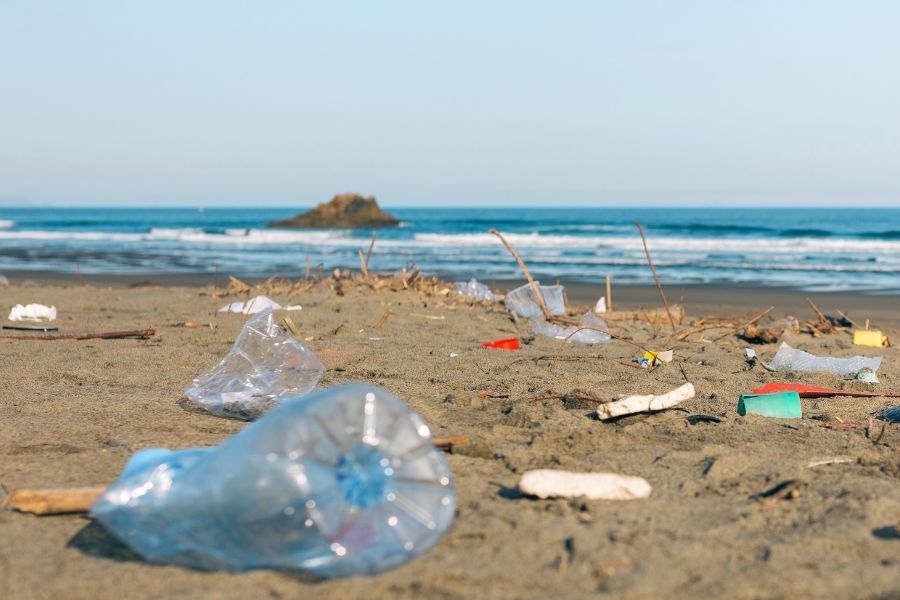
All over the world, beaches are some of the most polluted areas on Earth. 73% of all litter (i.e., food wrappers, bottles, cigarette butts, grocery bags) on beaches worldwide is plastic (Vuleta, 2022). Plastic bottles are the third most collected plastic trash on beaches in more than 100 countries (Vuleta, 2022). The United Kingdom receives an average of 5,000 pieces of plastic trash per mile on their beaches or 150 plastic bottles every mile (Vuleta, 2022).
All five of the planet’s oceans are receiving tons of garbage pieces (most of them plastic). For instance, the Atlantic Ocean hosts around 200 million tons of plastic trash. The Pacific Ocean has the highest amount of garbage (Vuleta, 2022).
Which countries are the worst?
Nearly 1.8 trillion pieces of garbage are produced around the globe, which can cover an area that is double the size of Texas (Vuleta, 2022). Which countries produce the most plastic waste?
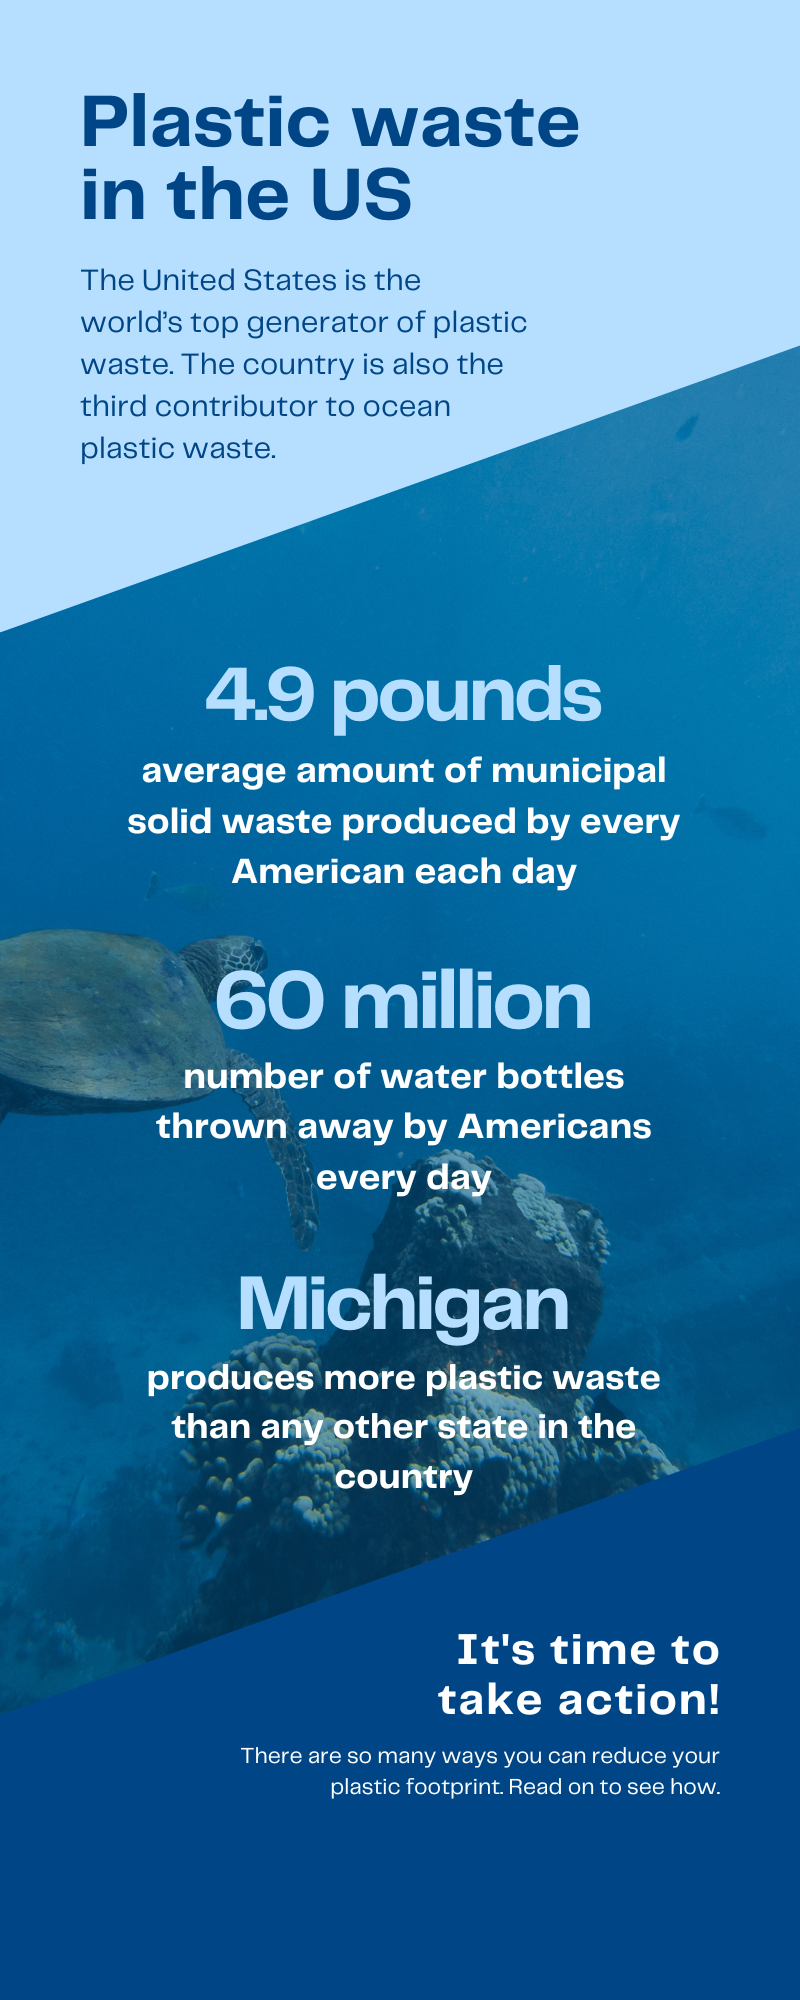
The United States is the world’s top generator of plastic waste. The country is also the third contributor to ocean plastic waste. To illustrate, more than 60 million plastic water bottles are thrown away in the United States each day. In the United States, Michigan produces more plastic waste than any other state in the country. More than 2 million tons of plastic bottles are discarded in U.S. landfills. That is, the country’s landfills have the highest amount of trash, accounting for over 62 tons per person. As for the whole country, there are 27 million tons of plastic in landfills, and more than 2 million of these are plastic water bottles. Statistics show that there are Americans opening a bottle of water every second of every day (Vuleta, 2022).
The United States also produced more than 14.5 million tons of plastic containers and packaging. The types of plastic in this category include bags, PET bottles, sacks, jars, wraps, and many types of other containers and packaging (Vuleta, 2022).
- The United States is the largest economy in the world, represents 4% of the global population, and produces 12% of the municipal waste worldwide (Vuleta, 2022).
- Australia's bottled water produces more than 60,000 tons of greenhouse gas emissions every year (Vuleta, 2022). This corresponds to the same level of air pollution of 13,000 cars emitting over 12 months (Vuleta, 2022).
- Together with Canada and Mexico, the United States have been responsible for 18% of the planet’s plastic waste. However, the plastic recycling rate in the United States is just 9% (Vuleta, 2022).
- Ten rivers from two continents are responsible for 90% of plastic pollution in the oceans. Two in Africa and eight in Asia. These are the primary and most channels of plastic polluted rivers in the word: Chang Jiang, Indus, Huang He, Hai He, Nile, Ganges-Brahmaputra-Meghna, Zhujiang, Amur, Niger, and the Mekong (Vuleta, 2022).